Audio analysing concepts
We'll be using WebAudio API for analysing audio.
WebAudio API
"The WebAudio PI provides a powerful and versatile system for controlling audio on the Web, allowing developers to choose audio sources, add effects to audio, create audio visualizations, apply spatial effects (such as panning) and much more." (official docs here)
Text book definition. I don't know any better because it's a really complicated API, and what I was concerning about is mainly the AnalyserNode.
However, to understand how we can use the AnalyserNode to process the audio data, we need to grab some concepts about the Fast Fourier Transform first.
Audio Processing with Fast Fourier Transform (FFT)
I won't delve too deeply into theories of the FFT, nor do I think I could, for I haven't fully understood it myself. Regardless, I will try to provide the best explanation in my understanding.
When we store digital audio (such as music), we are storing amplitude information over time. Think of a band recording a song with a guitar, a drum and a piano. The guitar has its own amplitude and frequency, and so do the drum and the piano. Together they created the song's recording, with the resultant amplitude graph looking like this:
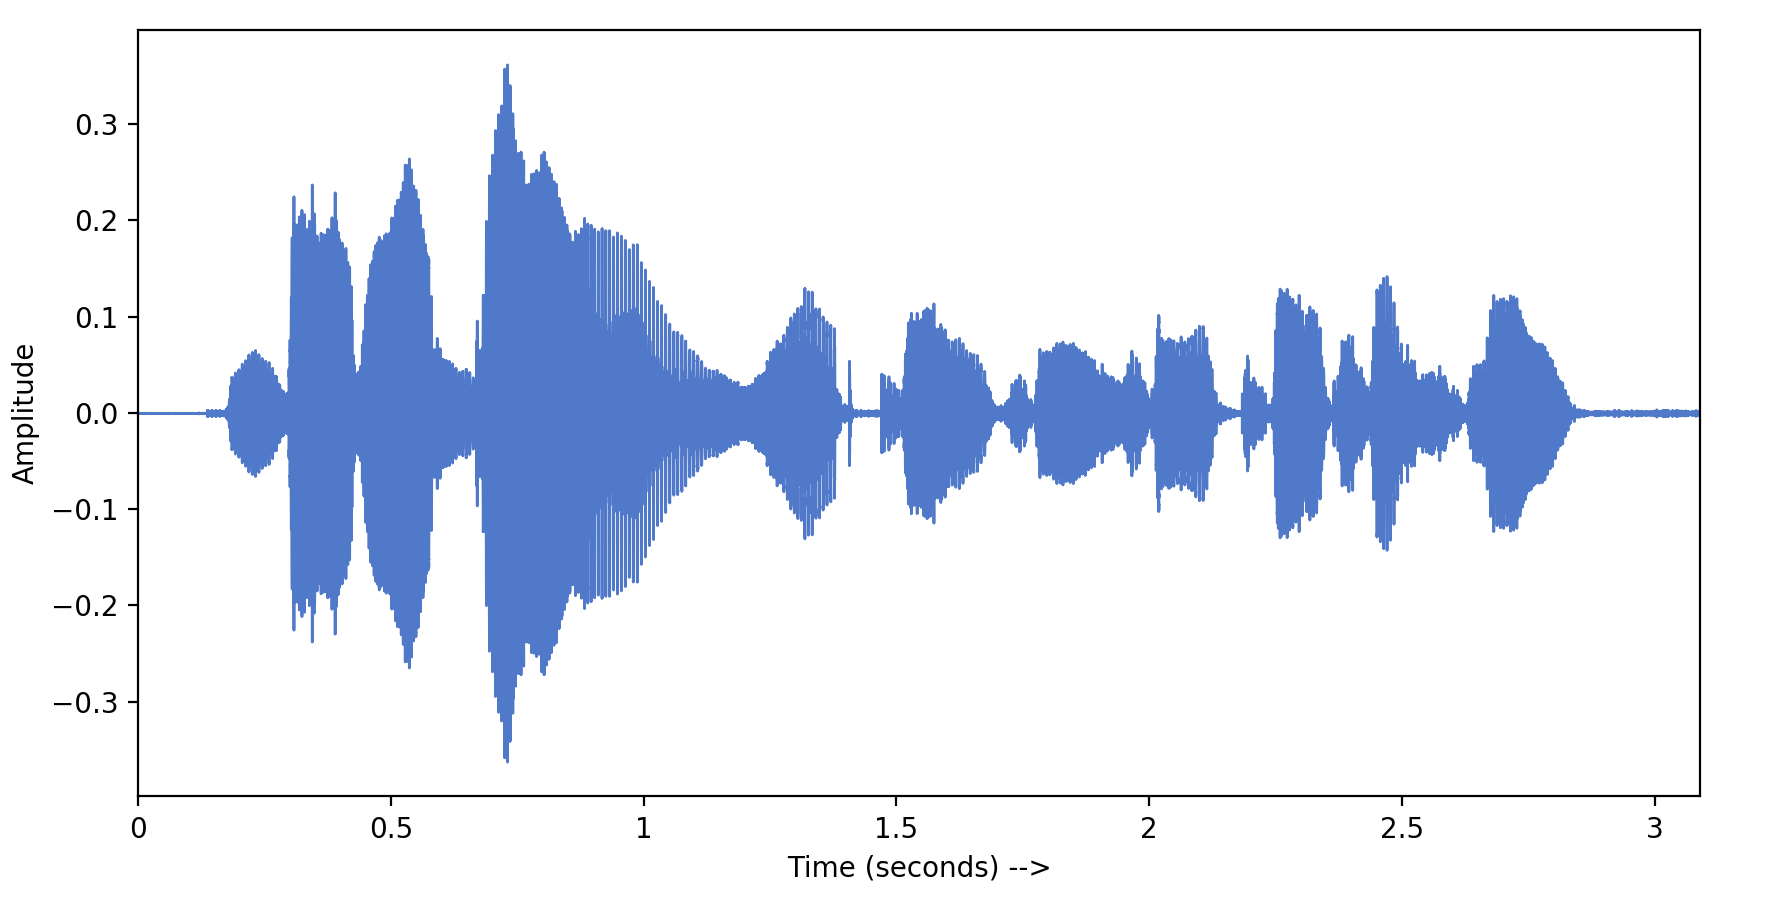
These amplitudes are not very informative, as they only talk about the general loudness of the recording over a time domain, with absolutely no way to tell what instrument is playing at which frequency & amplitude.
Now what if we want to seperate and visualize the amplitude of each instrument? What if we want to know how lound a sound at frequency, e.g, 40Hz is? That's when we need to use FFT.
You can think of FFT as a recipe finder. We input a cake, it will output the recipe for that cake. We input a non-linear soundwave, FFT will help us separate it into the original partial waves at their own frequency & amplitude:
It's probably over-simplified, but it's the gist of Fourier Transform. I think. My current knowledge is really limited on this topic.
You can refer to these two links for a much better & more detailed explanation:
https://betterexplained.com/articles/an-interactive-guide-to-the-fourier-transform/
Now that we get FFT out of the way, let's move on to AnalyserNode.
AnalyserNode
We'll use the method getFloatFrequencyData(), which uses FFT under the hood to determine the frequency domain. The returned value is a normalized array of values between 0 and 255, representing the power value (amplitude) of the sound at each calculated frequency.
For example:
- 1000Hz: 255 (loud),
- 2000Hz: 196 (less loud),
- 3000Hz: 40 (less less loud),
- 4000Hz: 0 (silent at this frequency),
- ...
The array of frequency we'll calculate depends on the frequencyBinCount>), which is determined by fftSize. fftSize is an input of the Fast Fourier Transform so I won't go deep into it, but here's my ELI5 explanation for the frequencyBinCount part:
Imagine we are calculating amplitude in the frequency domain from 0 -> 10000Hz. If the frequencyBinCount is 10, we will calculate the amplitude of frequencies with a step of 10000Hz / 10 = 1000Hz, meaning: 0, 1000Hz, 2000Hz, 3000Hz, ...
Using the returned result, we can visualize the amplitude of the sound over a Frequency Domain. Once again please take a look at how it works here.
