The site you're reading publishes itself when a post merges. On 2026-08-19 that meant CI compiled about 2,000 markdown files, built 3,080 static pages, and deployed three Cloudflare surfaces: a static Worker, an API Worker, and a D1 search index. The publish step showed 1m50s under a green checkmark. We spent a morning reading its raw log line by line. The step now runs in 78 seconds, and the time was the least valuable thing we found.
TL;DR. A green step hides its phases until you index the timestamps. Ours hid a 40-second serial tail and three bugs that had shipped for weeks. Then agents began pressing deploy all day, and the Releases tab went through three designs in 43 days: one release per deploy, one per merged PR, one per week. The second design let 184 releases pile up. The same log reading also caught our own earlier fix coming undone, which is the last section.
Numbers dated 2026-08-19 describe the memo publish job as it was that day. The platform monorepo (dwarvesf/foundation-workers, private) supplies the release numbers. A #NNN below is a pull request there unless the text names another repo. The repo is private, so the numbers are plain references for traceability and link nowhere; only Dwarves staff can open them.
1Read the log as a timeline
A CI step hides a dozen phases behind one duration number. The raw log has a timestamp on every line, so the first move is to index it: mark where each phase starts, subtract, and write down the table.
| Phase | Time |
|---|---|
| Vault fetch + install | 9s |
| Markdown compile (1,954 files) | 9s |
| Metadata generators | 4s |
| Next.js build (3,080 pages, warm cache) | 27s |
| RSS, redirects, lint bundle | 9s |
| Deploy static Worker | 17s |
| Deploy API Worker | 8s |
| R2 upload | 4s |
| D1 seed | 11s |
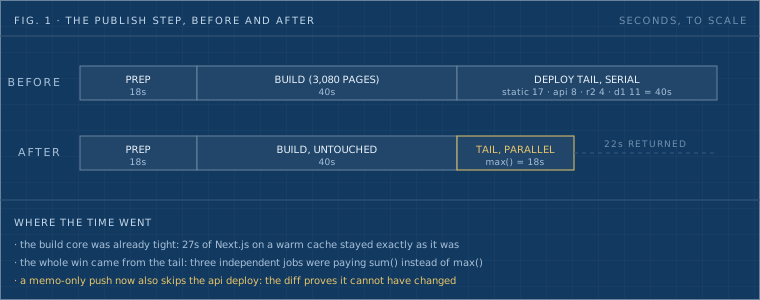
Two things jump out of a table like this that never jump out of a checkmark. The build core was already tight: 27 seconds for 3,080 pages with a warm compiler cache is fine, and we didn't touch it. The tail was the problem: 40 seconds of deploys and uploads running one after another, none of which depended on each other. Figure 1 above shows the same numbers to scale, before and after.
You don't need a log parser for this. The GitHub API returns every step of a run with its start and end time, and this prints them slowest first:
gh api repos/OWNER/REPO/actions/runs/RUN_ID/jobs --jq '
  .jobs[] | .name as $job | .steps[]
  | select(.started_at and .completed_at)
  | [$job, .name, ((.completed_at|fromdateiso8601) - (.started_at|fromdateiso8601))]
  | @tsv' | sort -t$'\t' -k3 -nr | head -5
That one command is the whole tool; nothing else to install. We ran it on the latest Deploy run of the platform monorepo (2026-10-17). The repo is private, so swap in your own run:
deploy	Deploy workers	97
deploy	Run actions/setup-node@v5	86
deploy	Run pnpm test	84
deploy	Run pnpm typecheck	11
deploy	Set up job	6
Hold on to the 86 seconds in the second row. The last section comes back to it.
2The green checkmark was hiding three bugs
Reading that closely also surfaced errors that had been shipping for weeks, because a step that exits 0 gets no scrutiny.
Finding 1
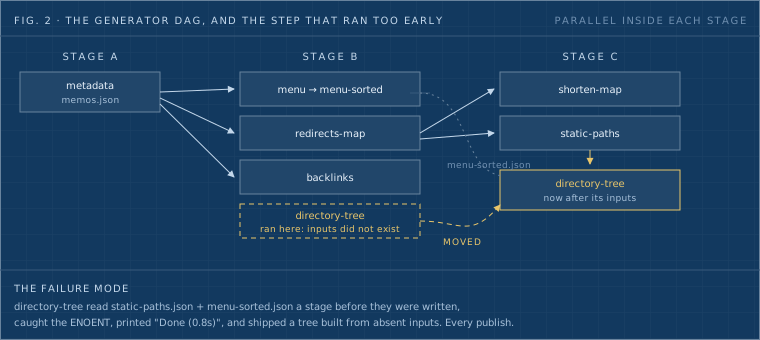
The generator DAG ran one step a stage too early (fig. 2). generate-directory-tree reads two JSON files that another generator writes, and it ran in the stage before the one that writes them. It logged an ENOENT stack trace, caught it, and printed "Done (0.8s)". Every publish shipped a directory tree built from files that didn't exist yet. The fix is one line in the stage list, plus the habit the bug taught us: write the dependency reason as a comment next to the stage, so the next person who reorders it has to argue with the comment.
Finding 2
The API Worker deployed before its database migrations ran. Nothing had blown up yet because no recent migration was load-bearing at deploy time. The day one is, the new code hits production a few seconds before the table it needs. Expand/contract is the boring, correct order: migrate first, deploy second.
Finding 3
The cleanup job was failing silently on most runs. Our PR-preview reaper runs under set -euo pipefail, and its target list came from a grep in a pipeline. On any PR with no worker changes, grep matches nothing, exits 1, and pipefail kills the step before it can print "nothing to reap". Six red runs in a row on 2026-08-18 and 19, all from the guard clause. { grep ... || true; } is the whole fix. The DAG fix (#600) and the reaper fix (#601) merged about eight minutes apart. The reaper ran on the close of #600 and failed with the exact bug #601 fixes.
3The formula
Here's the order we now hold every pipeline to, general first:
- Path-filter the trigger. A run that starts is the most expensive no-op.
- Guard before work: check env vars, read secrets capture-first, fail in seconds instead of after the build.
- Diff the push range per deployable. Our most common push is a memo post; it now skips the API deploy entirely, because the diff proves the API didn't change. Every uncertain answer falls back to deploying, so the skip can only ever be a correct no-op.
- Run generators as a staged DAG, parallel inside each stage, with the dependency reason written next to the stage.
- Keep caches on the runner. A persistent local dir for the compiler cache beats a 400MB cloud-cache tarball round trip by about 40 seconds.
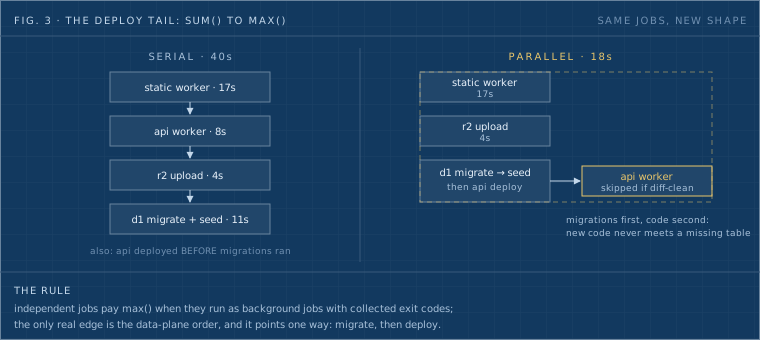
- Run the deploy tail in parallel. Independent jobs cost max() instead of sum(). Ours went from 40 seconds to 18 (fig. 3).
- Migrations before code, always.
- Write deltas. Our D1 seeder hash-gates rows ("0 changed of 1,611"), and Wrangler's asset manifest uploads only changed files: one file of 10,921 on a typical post.
- Retry idempotent network calls three times. Never retry a step whose repeat changes state.
- Sweep hazards by property. Oversized files get dropped by a size test; a filename list rots on the next addition.
Not every change helped. The first parallel-build change pinned the Next.js worker count to 8 on a runner with about four cores. That made next build about 11 seconds slower, and we reverted the pin less than six minutes after merging it (#597, #599). The parallel pre-steps from the same PR stayed.
The memo-specific parts stay memo-specific: the vault submodule advance, the redirect-map dance around Cloudflare's 2,000-rule cap, the search-index seeds. A formula that claims those would be lying about its portability.
4Where it landed
The first run on the new pipeline, phase by phase, straight from the log (fig. 4):
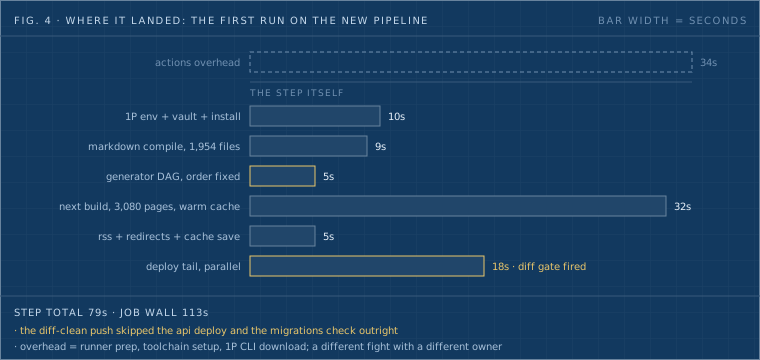
That is one run, not a distribution, and it has aged. The next day the monorepo's frontend copy was retired in favor of the one in foundation-apps, and the data plane moved to its own publish script (#629, #631, #633 on 2026-08-20). The single 78-second job no longer exists. The ordering rules carried over to both halves. The number did not.
Here is the current number, measured end to end. For the nine brainery PRs merged on 2026-10-17 (#361 to #367, #369 and #370; #368 was still open), we took GitHub's mergedAt as the start. The end is the completion time of the first successful Deploy memo run on foundation-apps created after the merge, because a merge dispatches both repos and that run is the frontend going live. The median is 5m22s, with a range of 3m55s to 9m31s. The data plane (memo-publish-on-push on foundation-workers) finishes first: a median of 2m56s, from 2m43s to 9m06s. The two slowest merges, #365 and #366, landed within four minutes of each other and of #367, so their runs overlapped. The first frontend run for #366 was cancelled, and the next run covered both. The other seven merges went live in 3m55s to 5m39s. These figures time a merge to a live page, so they do not compare with the 78 seconds, which timed one step.
The platform deploy, which ships about twenty Workers from one monorepo run, got the same pass on 2026-08-28 (#758). One job replaced two, the pnpm cloud cache was dropped, and the wrangler loop ran four Workers at a time. The baseline run measured 507 seconds of wall clock. A production run later that day took 181.
5When agents press deploy
Our platform monorepo deploys about twenty Cloudflare Workers out of one repository, in one pipeline run, from a manually dispatched GitHub Actions workflow. On 2026-08-11 we added a GitHub Release per production deploy so there would be a durable record of what shipped (#436). Within about half a day the Releases tab held four entries for five dispatches, covering roughly two distinct revisions, and we deleted them by hand (#448).
Nothing was broken: the pipeline did what we asked, and what we asked for was wrong.
Release-per-deploy is a fine default when a human decides to ship, writes a changelog, and presses a button on Friday afternoon. It stops being fine when an AI pair-programming session is doing the work. In that mode the loop is tight: make a change, commit, dispatch, look at production, adjust. The deploy button gets pressed because pressing it is how you see whether the thing works, not because a body of work is finished. Some of those dispatches are a one-line copy fix. Some are a retry because the first run looked ambiguous and re-running was cheaper than reading the log carefully.

Figure 5 is the cadence, from GitHub's deployments API: 754 jobs in 88 days, 10 days with none, a median of 5 a day. The jobs include Deploy and the memo publish, passing and failing, so the chart counts presses of the button. Under the first design every production dispatch minted a release. The tab that was supposed to be a history of meaningful revisions became a log of button presses, and a log of button presses is something we already had, called the Actions tab.
The naive fix is a retention policy: keep the last N releases, delete the rest. We did not do that on 2026-08-12, because it contradicts the reason releases exist. Deleting old releases discards exactly the history worth keeping. The pollution looked like a trigger problem, not a storage problem. We will come back to how well that held up.
We also added a human rule next to the technical ones, on 2026-08-19 (#602). Merges stack on main, and one production dispatch cuts the whole stack. A daily check nudges our logs channel when deployable commits have waited past 48 hours. Run by hand while we wrote it, the check found two deployable commits sitting past the last release.
6Gate the release, not the deploy
The fix that survived: keep deploying on every dispatch, and gate only the release. Two conditions, either of which skips the whole block (no release, no notification, one log line).
One, the commit came from a merged pull request. GitHub will tell you directly:
merged_pr=$(curl -sSf -H "Authorization: Bearer ${GH_TOKEN}" \
  -H "Accept: application/vnd.github+json" \
  "https://api.github.com/repos/${REPO}/commits/${GITHUB_SHA}/pulls" \
  | jq -r '[.[] | select(.merged_at != null)][0].html_url // empty')
For a squash-merge commit on the default branch, that returns the originating PR. For a direct commit it returns nothing. The job needs pull-requests: read for the lookup. We verified it against a real merge commit, the one that shipped the release feature itself, before trusting it rather than assuming the endpoint behaved as documented.
This is the load-bearing gate. A commit that never went through review was never a candidate for the release history in the first place, whatever the deploy pipeline did with it.
Two, this revision is not already released. Our tags carry a UTC timestamp, which means they never collide, which means a re-dispatch of the same commit happily mints a second release for a revision that already had one. That is precisely how four releases appeared for two revisions. So before minting, check the recent releases for one whose target_commitish already matches the deployed SHA, and skip if found.
A smaller thing, worth naming because it is the kind of error that survives review. The deploy notification carried a link labelled test run: passed. The link pointed at the whole workflow run, which includes the test job and the deploy loop that actually shipped every Worker. The URL was right and the label was wrong: it framed the message as a test-status check when the reader is trying to learn whether the revision shipped. It now reads deploy: succeeded. The release body kept saying "test run" until a follow-up (#453), so two surfaces described one event in two vocabularies, which is how people learn to distrust both.
7What is running right now
Gating releases behind merged PRs raises an obvious objection: if someone ships a small fix that never becomes a PR, how do we know what is actually running?
Not from releases at all. The deploy loop stamps the deployed commit onto every Worker as a plain variable, and a script reads that back off the live platform API:
worker configs under workers/, env production

workers/client/invoice          df-client-invoice        5427cca...
workers/contractor/payout       df-contractor-payout     5427cca...
workers/treasury/icy            df-treasury-icy          5427cca...
...

5427cca... -> UNRELEASED, https://github.com/.../commit/5427cca...
This reads live state, not a deploy log, so it answers "what is running right now" independently of whether a release exists. The UNRELEASED marker is the cross-reference we added afterwards (#449): every distinct live commit is checked against the Releases tab, and a live revision with no release says so instead of printing a bare hash. At the time of that PR all 19 production Workers sat on one commit, and the registry correctly called it unreleased, because we had just cleared the polluted releases by hand.
The registry has a failure mode of its own, and we found it on 2026-09-30 (#983). All four of its readers asked Cloudflare for the newest uploaded version of a Worker. That is not always the deployed one. Once PR previews began uploading versions onto the production script, any reader could report a preview commit as live. They now follow the deployments list to the version that carries traffic. A live-state check beats a log only if it reads the right live state.
8Push the warning, do not wait to be asked
A pull-based script only helps someone who thinks to run it. The failure mode worth catching is the one nobody is looking for. Our deploy loop skips any Worker whose config does not declare the target environment. That is deliberate, and it means a Worker can sit on an older commit while everything around it moves forward, with nothing surfacing the fact. So the registry script also runs inside the deploy step, and its output is grepped for one line (#450):
⚠️ 3 distinct commits are live. The estate is not on one build.
It is appended to the deploy notification only when there is drift, and never as an all-clear on a clean deploy, because a line that appears every time stops being read.

Figure 6 puts the pieces together. The top lane is the design this section described, and it stayed in place for six weeks. The bottom lane is what runs today.
9Three designs in 43 days
The gate stopped the duplicates. It did not keep the tab small, and what happened next is the part of this story we like least.
- 2026-08-20. We wrote the retention job we had argued against eight days earlier (#638): keep the newest 30 releases per tag prefix, dry run by default, real deletes only when a variable named RELEASE_PRUNE_ARMED is set.
- 2026-08-21. The variable was set. The one scheduled run that followed crashed on jq: Argument list too long.
- 2026-09-10. The housekeeping jobs moved into one Worker (#882). The arming flag did not come along, so the Worker only logged what it would delete.
- 2026-09-23. We noticed. 184 prod-* releases had piled up at two to five deploys a day (#924). We armed retention and moved it to a weekly run. The same day, the per-deploy release went away altogether (#928).
The tags did three jobs, and none of them needed one tag per deploy: a live marker for drift, a hook for the Discord post, and a changelog. The live marker now comes from Cloudflare. The post is a plain notice. The changelog is a weekly release, cut by the housekeeping Worker at the live commit, with notes from GitHub's generated list of PRs since the previous weekly tag. While reading the old code we also found that the Worker's drift check filtered for tags shaped like prod-YYYY-, and the real tags look like prod-20260816.113205. It had logged "no prod-YYYY-* tag found" every day.

As of 2026-10-17 the repo lists three weekly releases and 39 older prod- ones. The weekly Release is published on Sundays at 03:17 UTC (2026-09-27, 10-04 and 10-11). The repo's pipeline doc says Monday, and that doc has since been corrected: in Cloudflare's weekday numbering the cron 17 3 * * 1 fires on Sundays (#1139). A deploy posts the commit, the merged PR, a run link, and the drift line, and mints nothing.
Our position after all three: a Release is a calendar cut at the commit that is live. A trigger-driven release, whether per deploy or per merged PR, makes retention a permanent chore. We learned that by building the retention job and then failing to turn it on.
10Four more rules, for the release side
The formula above ordered one pipeline. These four came from the release tab.
- Count deploys and releases as two numbers. Deploy as often as the work needs. Tie a release to a calendar or a reviewed change, never to a button press.
- Gate the record, not the action. Slowing deploys to protect the release history would have been the wrong trade, and deploys are cheap.
- Read what is live from the platform, then check which version your reader sees. Ours read an uploaded version where it should have read the deployed one.
- Arm a guard, then watch it run once. Our retention job existed for 34 days and never deleted a release.
Notifications stay quiet when things are fine. The drift line is valuable because it is rare.
11What the log says today
While re-checking this page's numbers we ran the command from the first section on the latest runs. On 2026-10-17 the second-slowest step was setup-node, at 86 seconds. That step was 50 seconds on 2026-08-27, and #758 removed the pnpm cache option on 2026-08-28 because restoring a 400MB tarball over the network is slower than reading the disk the runner already has. A comment in the workflow said so the whole time. Figure 8 plots the step for the latest successful Deploy run of each day.

The step sat at 0 or 1 second on every sampled day from 2026-08-28 through 2026-09-07. On 2026-09-09 it read 33 seconds. It stayed between 18 and 37 seconds through 2026-09-30, and from 2026-10-01 it ran between 68 and 117 seconds. On the 2026-10-17 run it took 86 of the job's 311 seconds.
The log of that run names what the step is doing. package-manager-cache is true, the step reports "This project is configured to use pnpm because package.json has a packageManager field", and a pnpm cache restore follows: 617MB on that run. The cause is proven. A change on 2026-09-07 (#875) added that packageManager field so CI would run pnpm 11 and honor our 14-day dependency-age rule. With the field present, setup-node@v5 turns its package-manager cache on by default, so every run downloaded a cloud-cache tarball for a store the runner already holds. The tarball was 177MB on 2026-09-10 and had grown to 617MB by 2026-10-01, which is the second jump in Fig. 8. A supply-chain fix had re-enabled the cache that #758 removed.
The fix is one input, package-manager-cache: false on the setup-node step (#1139, merged 2026-10-17). We proved it on the same runner with the same steps, one line apart: 66 seconds with the default, 0 seconds with the cache off. The last Deploy run before the fix showed 57 seconds.
Our own fix stayed undone for five weeks while the runs stayed green, until #1139 on 2026-10-17.
12Limits
- The 78 seconds is one run. It is the first run after the change, not a median, and the pipeline split in two the next day. The merge-to-live numbers cover nine merges on one day.
- No Releases-tab counts survive from before and after the gate. The releases were deleted by hand and later pruned, so the page compares the designs by their rules and dates, not by tab size.
- The gate was not tried end to end. It was checked against a real merge commit and against an existing release's commit, with a live negative control. A full production dispatch to test it was not worth a real deploy of about twenty Workers (#448, #544).
- The deploy counts mix workflows. Figure 5 counts every job that started on the production environment. It includes the memo publish and probably dry-run dispatches, and it starts on 2026-07-22 because that is the earliest record the API returned.
- The ordering rules are one stack. They come from Cloudflare Workers, GitHub Actions, and a self-hosted runner on a single Mac. We make no claim about any other.
- Fig. 8 stops before the fix. It plots 2026-08-27 to 2026-10-17, so it shows the cost and not the 0-second result of #1139, which was measured in a controlled probe on the same runner.
13Receipts
| Date | PR | What |
|---|---|---|
| 2026-08-11 | #436 | GitHub Release per production deploy |
| 2026-08-12 | #448 | Relabel the alert, skip duplicate releases, gate on a merged PR |
| 2026-08-12 | #449, #450 | Registry cross-reference with UNRELEASED, drift line in the alert |
| 2026-08-19 | #597, #599 | Parallel build steps; the worker-count pin and its revert |
| 2026-08-19 | #600, #601, #602 | DAG fix and parallel tail; reaper fix; release train and daily drift nudge |
| 2026-08-20 | #629, #631, #633 | Memo data plane ported, workflow flipped, retired apps/ deleted |
| 2026-08-20 | #638 | Release prune job, dry run by default |
| 2026-08-28 | #758 | Deploy: one job, local pnpm store, parallel loop |
| 2026-09-07 | #875 | Pin CI to pnpm 11 with a packageManager field |
| 2026-09-10 | #882 | One Worker replaces six housekeeping workflows |
| 2026-09-23 | #924, #928 | Arm release prune; weekly release replaces per-deploy tags |
| 2026-09-30 | #983 | Read the deployed version, not the newest uploaded one |
14The habit underneath
The pipeline was "working" the whole time. Pages published, checks were green, nobody was paged. The 110-second version and the 78-second version look identical from the outside, and the outside is where CI dashboards live. Read the timestamped log top to bottom once a quarter, or the first time a step's duration makes you frown. Budget an hour. Ours paid for itself before lunch, and the last reading found our own fix undone.