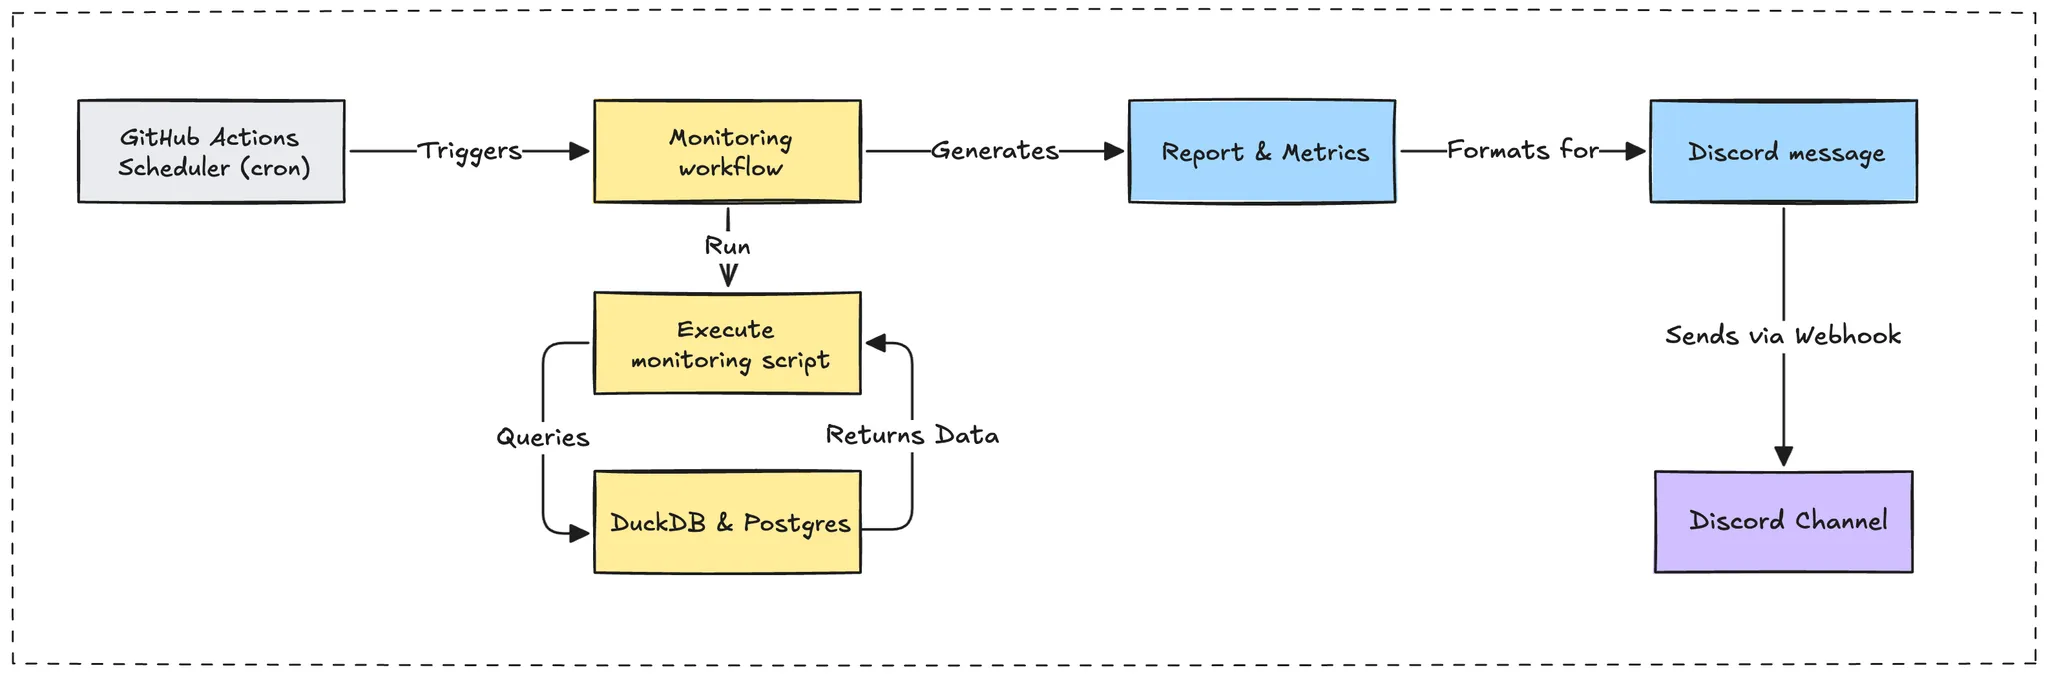
To ensure the operational reliability of our memo.d.foundation, we have developed a comprehensive, dual-mode monitoring system that combines proactive synthetic monitoring with reactive instrumental alerts. This integrated strategy provides complete visibility into platform health, from business metrics to real-time system events.
Key benefits of our dual-mode approach
Our hybrid monitoring strategy delivers significant operational advantages by addressing the limitations of traditional single-method systems:
- Proactive and reactive coverage: We combine scheduled "scout" checks for landscape-level health with event-driven "messenger" alerts for immediate issue notification, eliminating visibility gaps.
- Early issue detection: Synthetic monitoring identifies potential data quality or pipeline bottlenecks before they impact user experience or downstream processes.
- Real-Time event awareness: Instrumental monitoring provides immediate feedback on critical events, such as NFT mints and CI/CD pipeline status, enabling rapid engineering response.
- End-to-end data integrity: Our checks span the entire data lifecycle, from Markdown content ingestion and Parquet file health to database consistency and AI embedding generation.
Proactive health audits: Synthetic monitoring
Our synthetic monitoring platform operates on a fixed schedule, executing a series of checks against our core data assets and business logic. It serves as our early warning system, providing a regular pulse on the health of the entire memo.d.foundation system and catching issues before they escalate.
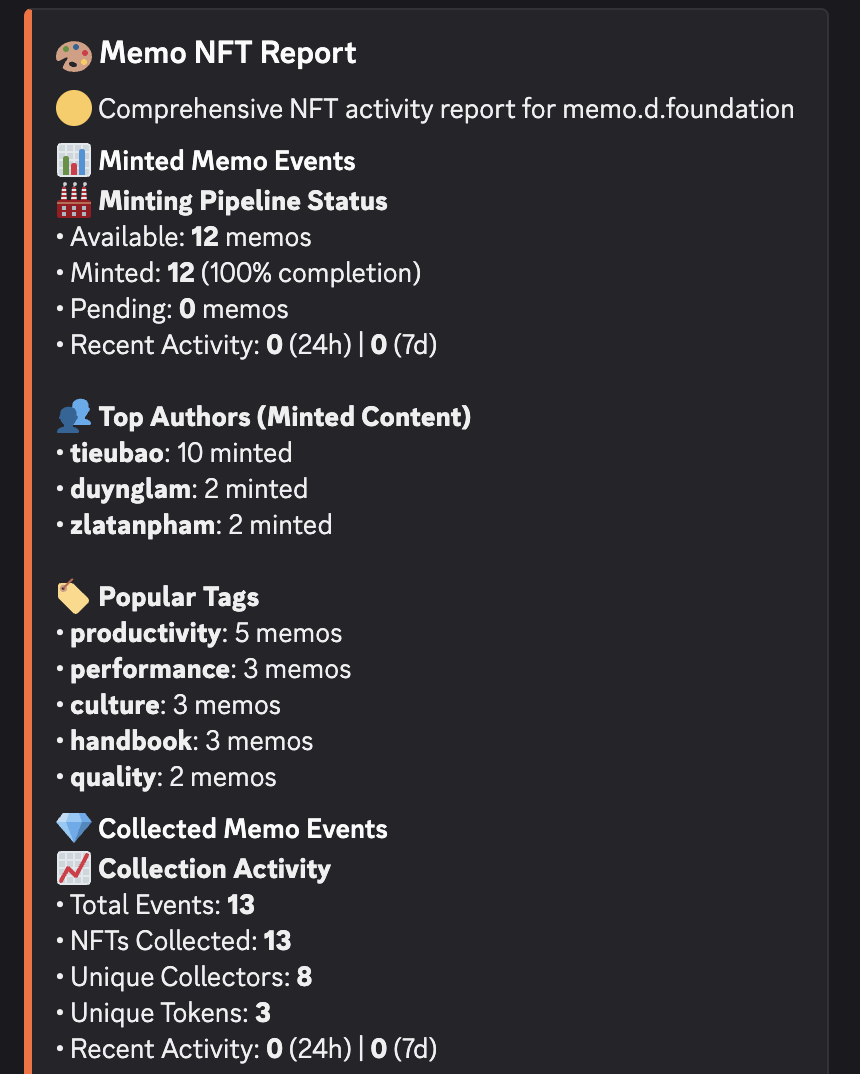
NFT system reporting (memo-nft-report.ts)
This daily report provides a comprehensive overview of our minting pipeline and NFT collection activity. It leverages DuckDB to execute federated queries across both our canonical Parquet vault and our production PostgreSQL database, unifying disparate data sources into a single, coherent view.
Federated data integration:
The system joins data from a remote Parquet file and a PostgreSQL table to generate a holistic report.
// Dual-source data integration with DuckDB
const vaultMetrics = await connection.runAndReadAll(`
  SELECT
    COUNT(CASE WHEN should_mint = true THEN 1 END) as mintable_total,
    COUNT(CASE WHEN should_mint = true AND minted_at IS NOT NULL THEN 1 END) as minted_count
  FROM read_parquet('https://memo.d.foundation/db/vault.parquet')
`);

const collectionMetrics = await connection.runAndReadAll(`
  SELECT
    COUNT(*) as total_events,
    SUM(amount) as total_collected
  FROM memo_nft_db.memo_nft.memo_minted_events
`);
This daily audit, running via a cron schedule in GitHub Actions, tracks key performance indicators, including:
- Minting pipeline health: Monitors success rates, queue depth, and pending content.
- Collection activity: Analyzes total collection events, revenue, and unique collectors.
- Author and content Trends: Identifies top contributors and popular content tags.
Data vault integrity (monitor-vault-parquet.ts)
This check is designed to verify the completeness and quality of our core knowledge vault. It provides a quick, color-coded health status that allows us to assess data integrity at a glance.
Data quality metrics:
Our script assesses the vault based on a predefined set of quality metrics.
interface VaultMetrics {
  totalRecords: number;
  missingDates: number;
  missingAuthors: number;
  missingEmbeddings: number;
  pendingMint: number;
  pendingArweave: number;
}
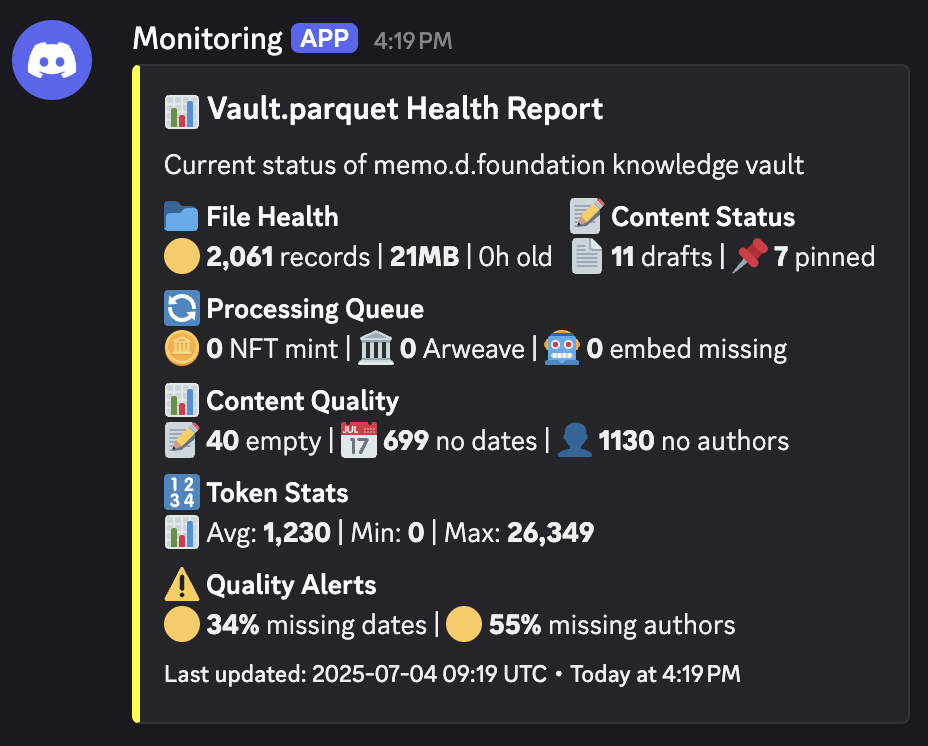
Health status logic:
The system uses tiered thresholds to classify the vault's health, ensuring we prioritize critical issues effectively.
const hasWarnings = metrics.missingDatesPercent > 25 || metrics.missingAuthorsPercent > 40;
const hasCritical = metrics.pendingMint > 20 || metrics.missingEmbeddings > 100;
const healthStatus = hasCritical ? '🔴 Critical' : hasWarnings ? '🟡 Warning' : '🟢 Healthy';
This provides actionable insights by immediately flagging which specific metrics have crossed their warning or critical thresholds, enabling focused remediation.
Real-time event notifications: Instrumental monitoring
Where synthetic monitoring is proactive, our instrumental monitoring is reactive. It operates across several integration layers to provide immediate notifications based on specific system events.
NFT minting alerts
When a new article is successfully minted as an NFT, our notify-discord-minted-articles.ts script is triggered. This process handles community communication by sending a rich, formatted Discord notification. We leverage the Model Context Protocol (MCP) to generate context-aware messages that are more informative and engaging than standard text.
MCP Integration for rich notifications:
await mcpDiscord.callTool({
  name: "discord-send-embed",
  arguments: {
    username: "Memo NFT",
    webhookUrl: process.env.DISCORD_WEBHOOK_URL,
    content: generatedMessage,
    title: "📢 New notes minted in the Memo",
    autoFormat: true,
  }
});
This system ensures both optimal performance and high reliability through:
- Connection resilience: Implements a retry mechanism for establishing the initial connection.
- Exponential backoff: If a notification fails, the system waits progressively longer before retrying, preventing API rate-limiting issues.
- Graceful error handling: Failures are logged without crashing the parent workflow.
CI/CD workflow monitoring
We have integrated instrumental monitoring directly into our GitHub Actions workflows. This provides real-time status updates on deployments and other critical automated processes, sending success or failure notifications to a dedicated Discord channel.
Standardized notification steps:
- name: Notify Discord on Success
  if: success()
  uses: sarisia/actions-status-discord@v1
  with:
    webhook: ${{ secrets.DISCORD_WEBHOOK_URL }}
    title: '✅ Deployment Completed Successfully'
    color: 0x00ff00

- name: Notify Discord on Failure
  if: failure()
  uses: sarisia/actions-status-discord@v1
  with:
    webhook: ${{ secrets.DISCORD_WEBHOOK_URL }}
    title: '❌ Deployment Failed'
    description: 'Please check workflow logs for details.'
    color: 0xff0000
System architecture and implementation
Our monitoring platform is built on a modern, flexible technology stack chosen for its performance, ease of integration, and alignment with our team's expertise.
The DuckDB analytics engine
We selected DuckDB as our core data processing engine due to its unique capabilities for in-process analytics. It allows us to perform complex analytical queries on local and remote data sources without the overhead of a traditional data warehouse.
Key advantages:
- Federated queries: Natively queries remote Parquet files and connects to our live PostgreSQL database in a single session.
- High performance: Columnar-vectorized query execution is highly optimized for analytical workloads.
- Zero-dependency: Runs entirely in-memory, simplifying our CI/CD environment setup.
PostgreSQL integration: The connection process involves loading the postgres extension and attaching our remote database as a read-only source.
async function setupDuckDBConnections(): Promise<DuckDBConnection> {
  const instance = await DuckDBInstance.create(':memory:');
  const connection = await instance.connect();

  // Load extensions and attach remote database
  await connection.runAndReadAll('LOAD postgres;');
  await connection.runAndReadAll(`
    ATTACH '${process.env.DB_CONNECTION_STRING}' AS memo_nft_db (TYPE postgres, READ_ONLY);
  `);

  return connection;
}
Security and data handling
We built our monitoring system with security and responsible data handling as core principles:
-
Secure credentials management: All credentials, such as API keys and database strings, are managed as GitHub Secrets. Access is limited by the principle of least privilege, and our services connect using a dedicated read-only database user to prevent accidental data modification.
-
Privacy by design: We practice data minimization in all public-facing reports to protect community privacy. For instance, collector wallet addresses are truncated to show activity trends without revealing full identities.
// Address truncation for privacy
const truncatedAddress = String(row.address || '').substring(0, 8) + '...';
Success metrics
We track a set of key performance indicators to measure the effectiveness of our monitoring infrastructure:
- Monitoring with Uptime: Targeting 99.9% uptime for all monitoring services, ensuring continuous visibility.
- Alert latency: Average delivery time for critical alerts is under 2 minutes.
- Data freshness: Reports leverage data that is never more than 6 hours old.
- Query performance: Complex analytical reports complete in under 30 seconds.
What's next?
While the current work provides a solid foundation, we have several enhancements planned to further improve our monitoring capabilities:
- Automated remediation: For common, well-understood issues, we will explore self-healing capabilities to reduce manual intervention.
- Executive dashboards: We will create higher-level dashboards that distill technical metrics into clear business insights for leadership.
